New Renters and the Rent CPI
In a previous post, we discussed how movements in market and new tenant rents have been shown to predict movements in the rent components of official price indexes. Since then, updated data have been released for the New Tenant Rent Index (NTRI, now maintained by the Bureau of Labor Statistics). This release indicates that new tenant rents in the fourth quarter of 2023 fell 8.8 percent versus the previous quarter and were down 4.6 percent versus a year ago. Figure 1 below shows the relationship between the NTRI and the rent component of the Consumer Price Index (CPI), suggesting that the CPI measure is likely to exhibit slower growth this year.

Figure 1 also shows the difference in the behavior of these two series since the pandemic. During the Great Recession, for example, there appeared to be a much tighter co-movement between new tenant rents and the CPI for rent shelter. In contrast, a significant gap has emerged between the latest year-over-year growth rate of the rent CPI and the year-over-year growth rate of the NTRI.
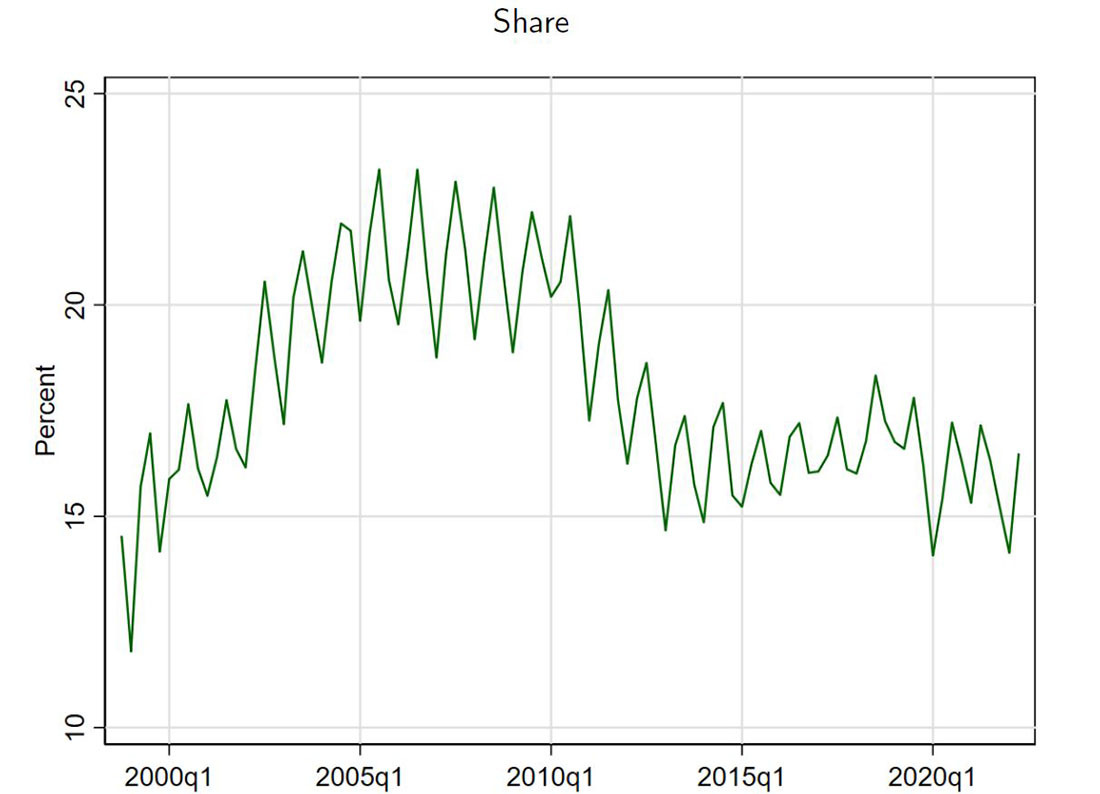
One factor that might contribute to a changing relationship between the NTRI and the rent CPI is that new tenants have become a smaller share of the sample of rental units surveyed by the BLS. This is because the BLS attempts to survey a representative sample of rental units rather than a sample of renters, and it does not explicitly target a particular share of new renters in its sample of housing units. Figure 2 below reproduces a figure from the original working paper describing the calculation of NTRI, which shows that the share of new tenant units has fallen from over 20 percent during the Great Recession to just over 15 percent since 2020.
Alternative data on lease renewals from RealPage Analytics also indicate that the share of renewing renters increased following the pandemic: In November, 51.8 percent of apartment renters with expiring leases signed renewals, down versus 2022 levels but still higher than any November in the decade prior to the pandemic. These changes in the renter population — combined with the wider gap in rent growth between new and existing renters during the pandemic as documented by the BLS — may have weakened the relationship between the NTRI and the rent CPI.
Looking at the issue from a different angle, other data support the view that there are fewer new renters than before. Figure 3 below shows data from the New York Fed's Survey of Consumer Expectations, in which respondents are asked about their expected probability of moving into a new primary residence over the next 12 months. As of December, the six-month moving average is 14.3, the lowest since the start of the survey in 2013. The downward decline in expectations for moving appears to be consistent with households becoming less mobile and, by extension, new renters becoming less prevalent.

Figure 4 below shows the share of young adults living at home with their parents, courtesy of the Census Bureau's Current Population Survey Annual Social and Economic Supplement. In 2023, 32.4 percent of young adults lived at home with their parents, up 1 percentage point from the previous year and up 3 percentage points from 2009. As young adults are more likely to be renters when first leaving home, the increase in the share staying with their parents may have reduced the size of the new renter population.

While fewer new renters reflected in the CPI's sample of rental units won't completely break the relationship between new tenant rents and the rent CPI — and while the CPI for rents does appear on track to slow further in year-over-year terms — the once very-tight relationship between the rent CPI and the NTRI could be less tight in the future. In addition, the BLS's warning that the NTRI is "perpetually revised, with recent periods being prone to large revisions" means that forecasters using these data should remain cautious about declaring a quick end to today's elevated rent inflation.
Views expressed in this article are those of the author and not necessarily those of the Federal Reserve Bank of Richmond or the Federal Reserve System.